If you're trying to plan hiring for the rest of 2026, the second quarter didn't make it easy on you. The government's numbers looked soft. The actual demand employers are putting into the market looked fine, even good in places. AI is quietly rewriting which roles are worth opening. And pay transparency is spreading well beyond the states that actually require it. Here's what the data says, pulled from our own Q2 job posting data alongside the latest federal releases, so you can see how our numbers line up with the bigger picture.
The payroll story keeps getting worse in the rearview mirror
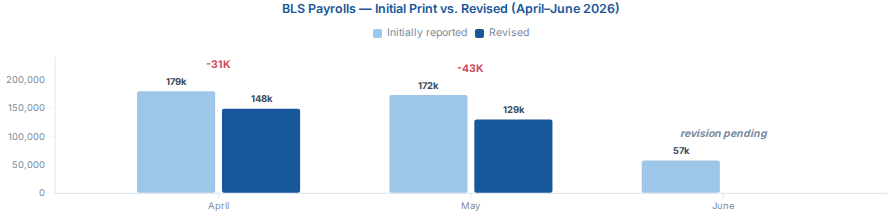
The headline number for June was weak: just 57,000 jobs added, in line with what's been a pretty quiet 12-month average of around 36,000 a month, according to the Bureau of Labor Statistics' Employment Situation report. The unemployment rate held at 4.2%, with 7.1 million people out of work.
But the more interesting story is what happened to the two months before it. April's initial estimate of 179,000 jobs added got revised down to 148,000, a cut of 31,000. May went from 172,000 to 129,000, down 43,000. Combined, that's 74,000 jobs that the government thought existed in April and May and then quietly took back. Two months of double-digit-thousand downward revisions in a row is the kind of pattern that tells you the labor market cooled off faster than the first headlines let on.
For context, the BLS also reported that leisure and hospitality shed 61,000 jobs in June, which the agency chalked up to weaker-than-usual seasonal hiring, while professional and business services (+36,000) and social assistance (+25,000) kept adding.
Job openings held up better than payrolls did
Here's where it gets more reassuring. The BLS JOLTS report for May showed job openings holding flat at 7.6 million, a 4.6% rate, with the only real gain coming from wholesale trade (+71,000 openings). Quits stayed put at 1.9%, and hires held at 3.3%. Nothing dramatic in either direction, though in a pattern that should sound familiar by now, BLS has since revised that May figure down to 7.5 million, a 4.5% rate.
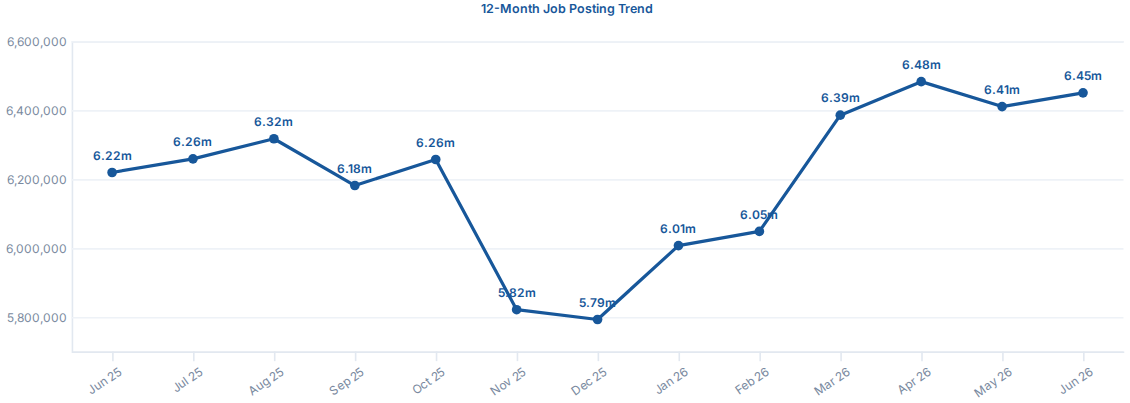
Our own posting data tells a version of the same story, just with a little more texture. National postings dipped through the back half of 2025, bottoming out around 5.79 million in December, then climbed back to about 6.45 million by June 2026. That's up from 6.22 million a year earlier, roughly 3.7% growth YoY. Recruiting-agency postings followed a similar shape: a low near 1.11 million in February, recovering to 1.30 million by June, up about 2.7% YoY.
Put it together, and you get a labor market that's cooling in the official payroll counts but where employer demand, at least as measured by what companies are actually posting, hasn't fallen off a cliff. Economists at the Federal Reserve Bank of Chicago have been calling this pattern "low-hire, low-fire," and their numbers back it up. Since January 2023, unemployment has climbed about a full point, from 3.4% to 4.3% as of the Chicago Fed's most recent read this year, though June's official BLS rate of 4.2% suggests that climb has leveled off rather than kept accelerating. Roughly 80% of the increase traces back to weaker hiring rather than more layoffs, which only account for the remaining 20%. Layoffs have crept up gradually since 2024, but nowhere near the pace you'd see in a typical downturn. In plain terms: employers aren't cutting people; they're just being slower to add them. Our own postings and vacancy data line up with the "slower to add" half of that story; even as the raw number of openings recovers, employers appear to be taking longer to convert those postings into actual hires.
Where hiring is heating up
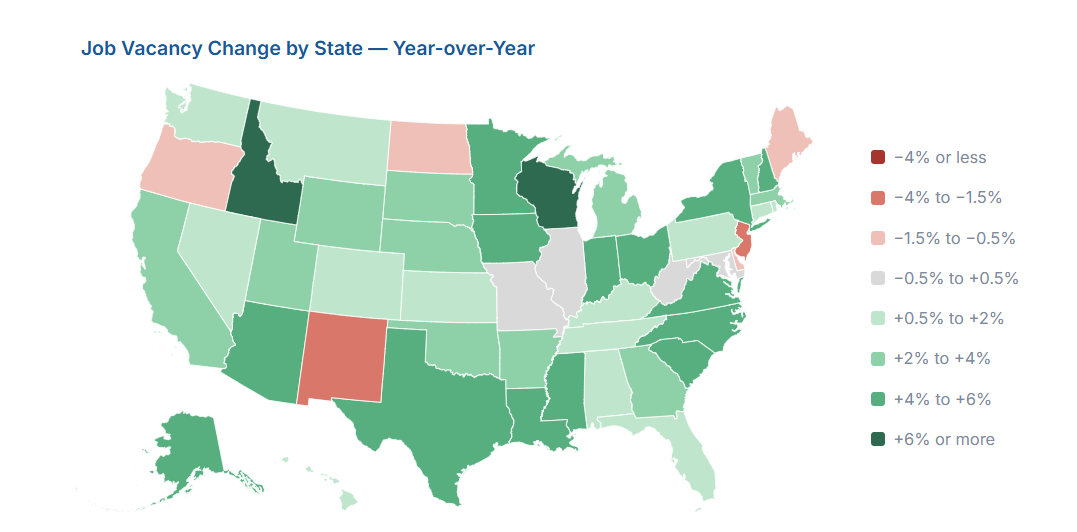
State by state, the divergence was pretty stark. Washington, D.C. led the country with postings up 11.5% YoY, followed by Wisconsin (+7.4%), Idaho (+6.7%), Texas (+6.0%), Virginia (+5.9%), North Carolina (+5.6%), and Iowa and Mississippi (both +5.5%). On the other end, New Mexico (-3.9%) and New Jersey (-2.6%) took the biggest hits, with Oregon, Delaware, North Dakota, and Maine also posting modest declines.
Worth noting: that D.C. figure is the district alone. The broader Washington metropolitan area (Washington-Arlington-Alexandria, DC-VA-MD-WV), which spans into Maryland and Virginia, deserves its own callout too. Postings there dipped to a low of about 134,500 in November 2025, then climbed to 157,415 by June 2026, a 7.6% year-over-year jump and one of the stronger regional rebounds we tracked all quarter.
AI isn't killing jobs so much as sorting them
This is probably the part employers should read most closely. In our data, postings for AI Specialists were up an eye-popping 94.8% year over year. Data Analysts (+19.8%), DevOps (+13.9%), and Project Managers (+13.4%) all rode that same wave.
But it's not one-directional. Roles you'd expect to be squeezed by automation showed a mixed picture: UI/UX Designer postings fell 14.9%, and Cashier postings slipped 1.1%, while Data Entry Clerk postings actually rose 10.0%. Roles in the "still very human" bucket weren't immune either. Social Worker postings dropped 10.2%, and Agriculture Worker postings fell 1.9%, while Civil Engineer held roughly flat.
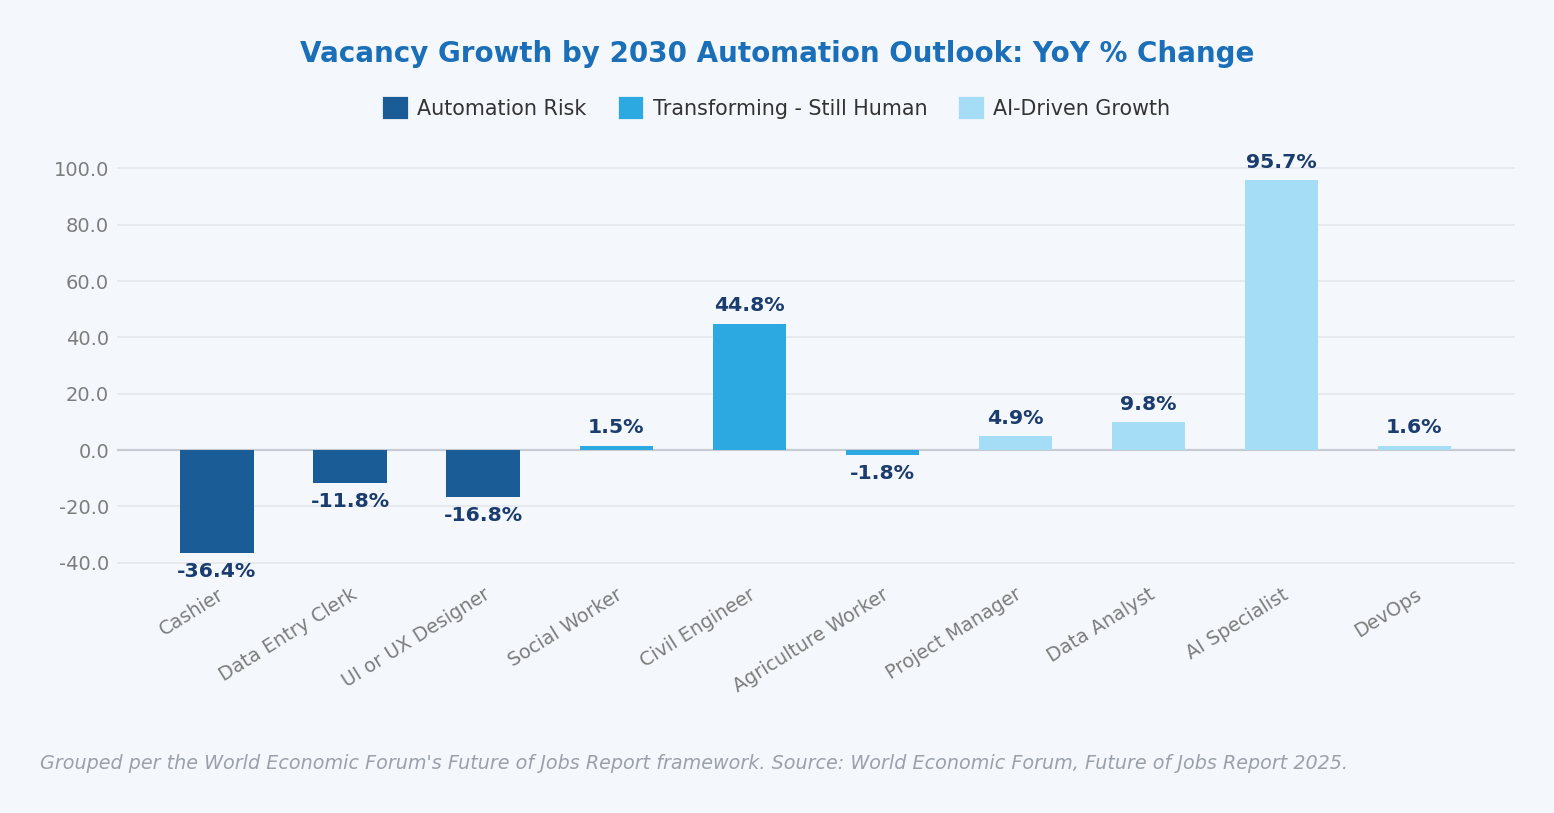
For a longer-lens view of the same divide, the chart below maps vacancy growth against the World Economic Forum's 2030 automation-outlook framework, which buckets roles into automation risk, transforming-but-still-human, and AI-driven growth. AI Specialist is the runaway leader on the growth side, while Cashier shows the sharpest pullback of any role in the chart, a reminder that the roles under the most pressure aren't always the ones getting the headlines.
Here's the part that should really get employers' attention: the pain is landing hardest on the youngest workers. A recent Stanford Institute for Economic Policy Research brief found little evidence that AI is causing broad job losses across the workforce as a whole. Still, recent graduates now face a 5.6% unemployment rate, well above where it stood a few years ago. So the honest read isn't that AI is shrinking the overall job market. It's redrawing the entry point into it, and that's worth factoring into how you structure junior hiring and early-career pipelines.
For employers, the practical takeaway is that this isn't a story about shrinking headcount. It's a story about where the headcount is going. If your req list still looks like it did two years ago, it's worth checking whether the roles you're hardest pressed to fill are the ones showing up in that AI-driven growth column.
.
Pay transparency is spreading faster than the laws requiring it
Salary disclosure kept climbing across the board this quarter. In states with pay transparency laws on the books, the share of postings listing salary rose from 74.2% in June 2025 to 81.2% by June 2026. What's notable is that disclosure also climbed in states without any such mandate, from 38.3% to 42.7% over the same stretch. Employers are getting ahead of a trend rather than waiting to be forced into it.
That trend has real legal backing behind it too. As of 2026, states requiring salary ranges in job postings include California, Colorado, Connecticut, Hawaii, Illinois, Maryland, Massachusetts, Minnesota, Nevada, New Jersey, New York, Rhode Island, Vermont, Washington, and D.C., with Delaware set to join in 2027 and several cities in Ohio enforcing their own local requirements. According to Jackson Lewis, California's SB 642 (effective January 2026) tightened the definition of "pay scale" and extended the recovery period for violations to six years. New York and Washington also updated their rules this year. With that many jurisdictions moving in the same direction, it's not hard to see why even employers outside the mandated states are choosing to post salary ranges anyway. It's simply becoming the norm candidates expect.
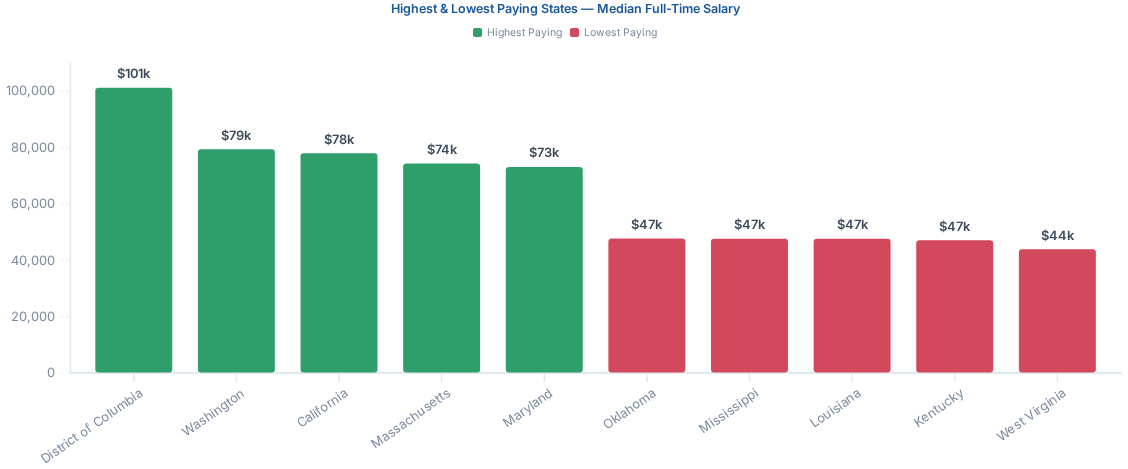
Pay itself still varies enormously by geography. The highest average postings by state were in D.C. ($100,942), Washington ($79,092), California ($77,657), Massachusetts ($74,058), and Maryland ($72,800). The lowest were in Oklahoma ($47,497), Mississippi ($47,403), Louisiana ($47,362), Kentucky ($46,862), and West Virginia ($43,680), a gap of more than $57,000 between the top and bottom of the list.
The bottom line
Q2 2026 wasn't a story of the labor market cooling evenly across the board. It was a story of divergence. Official payroll growth keeps getting revised down after the fact, even as job openings and postings hold up better than the headlines suggest. AI is creating explosive demand for a narrow set of roles while leaving the broader employment picture more or less intact, at least for now, with the clearest strain showing up among entry-level workers. Pay transparency is becoming table stakes whether or not your state requires it. And the channels candidates use to find your openings are shifting fast enough that last year's sourcing playbook may already need a second look.
View full report